
Fault memory & measured values
Read the fault memory, check all ECUs with AutoScan, monitor and record measured values live: these are CarPort's read-only diagnostic functions.
These functions don't change any configuration in the vehicle and can therefore be run without risk. They form the basis of all troubleshooting.
AutoScan
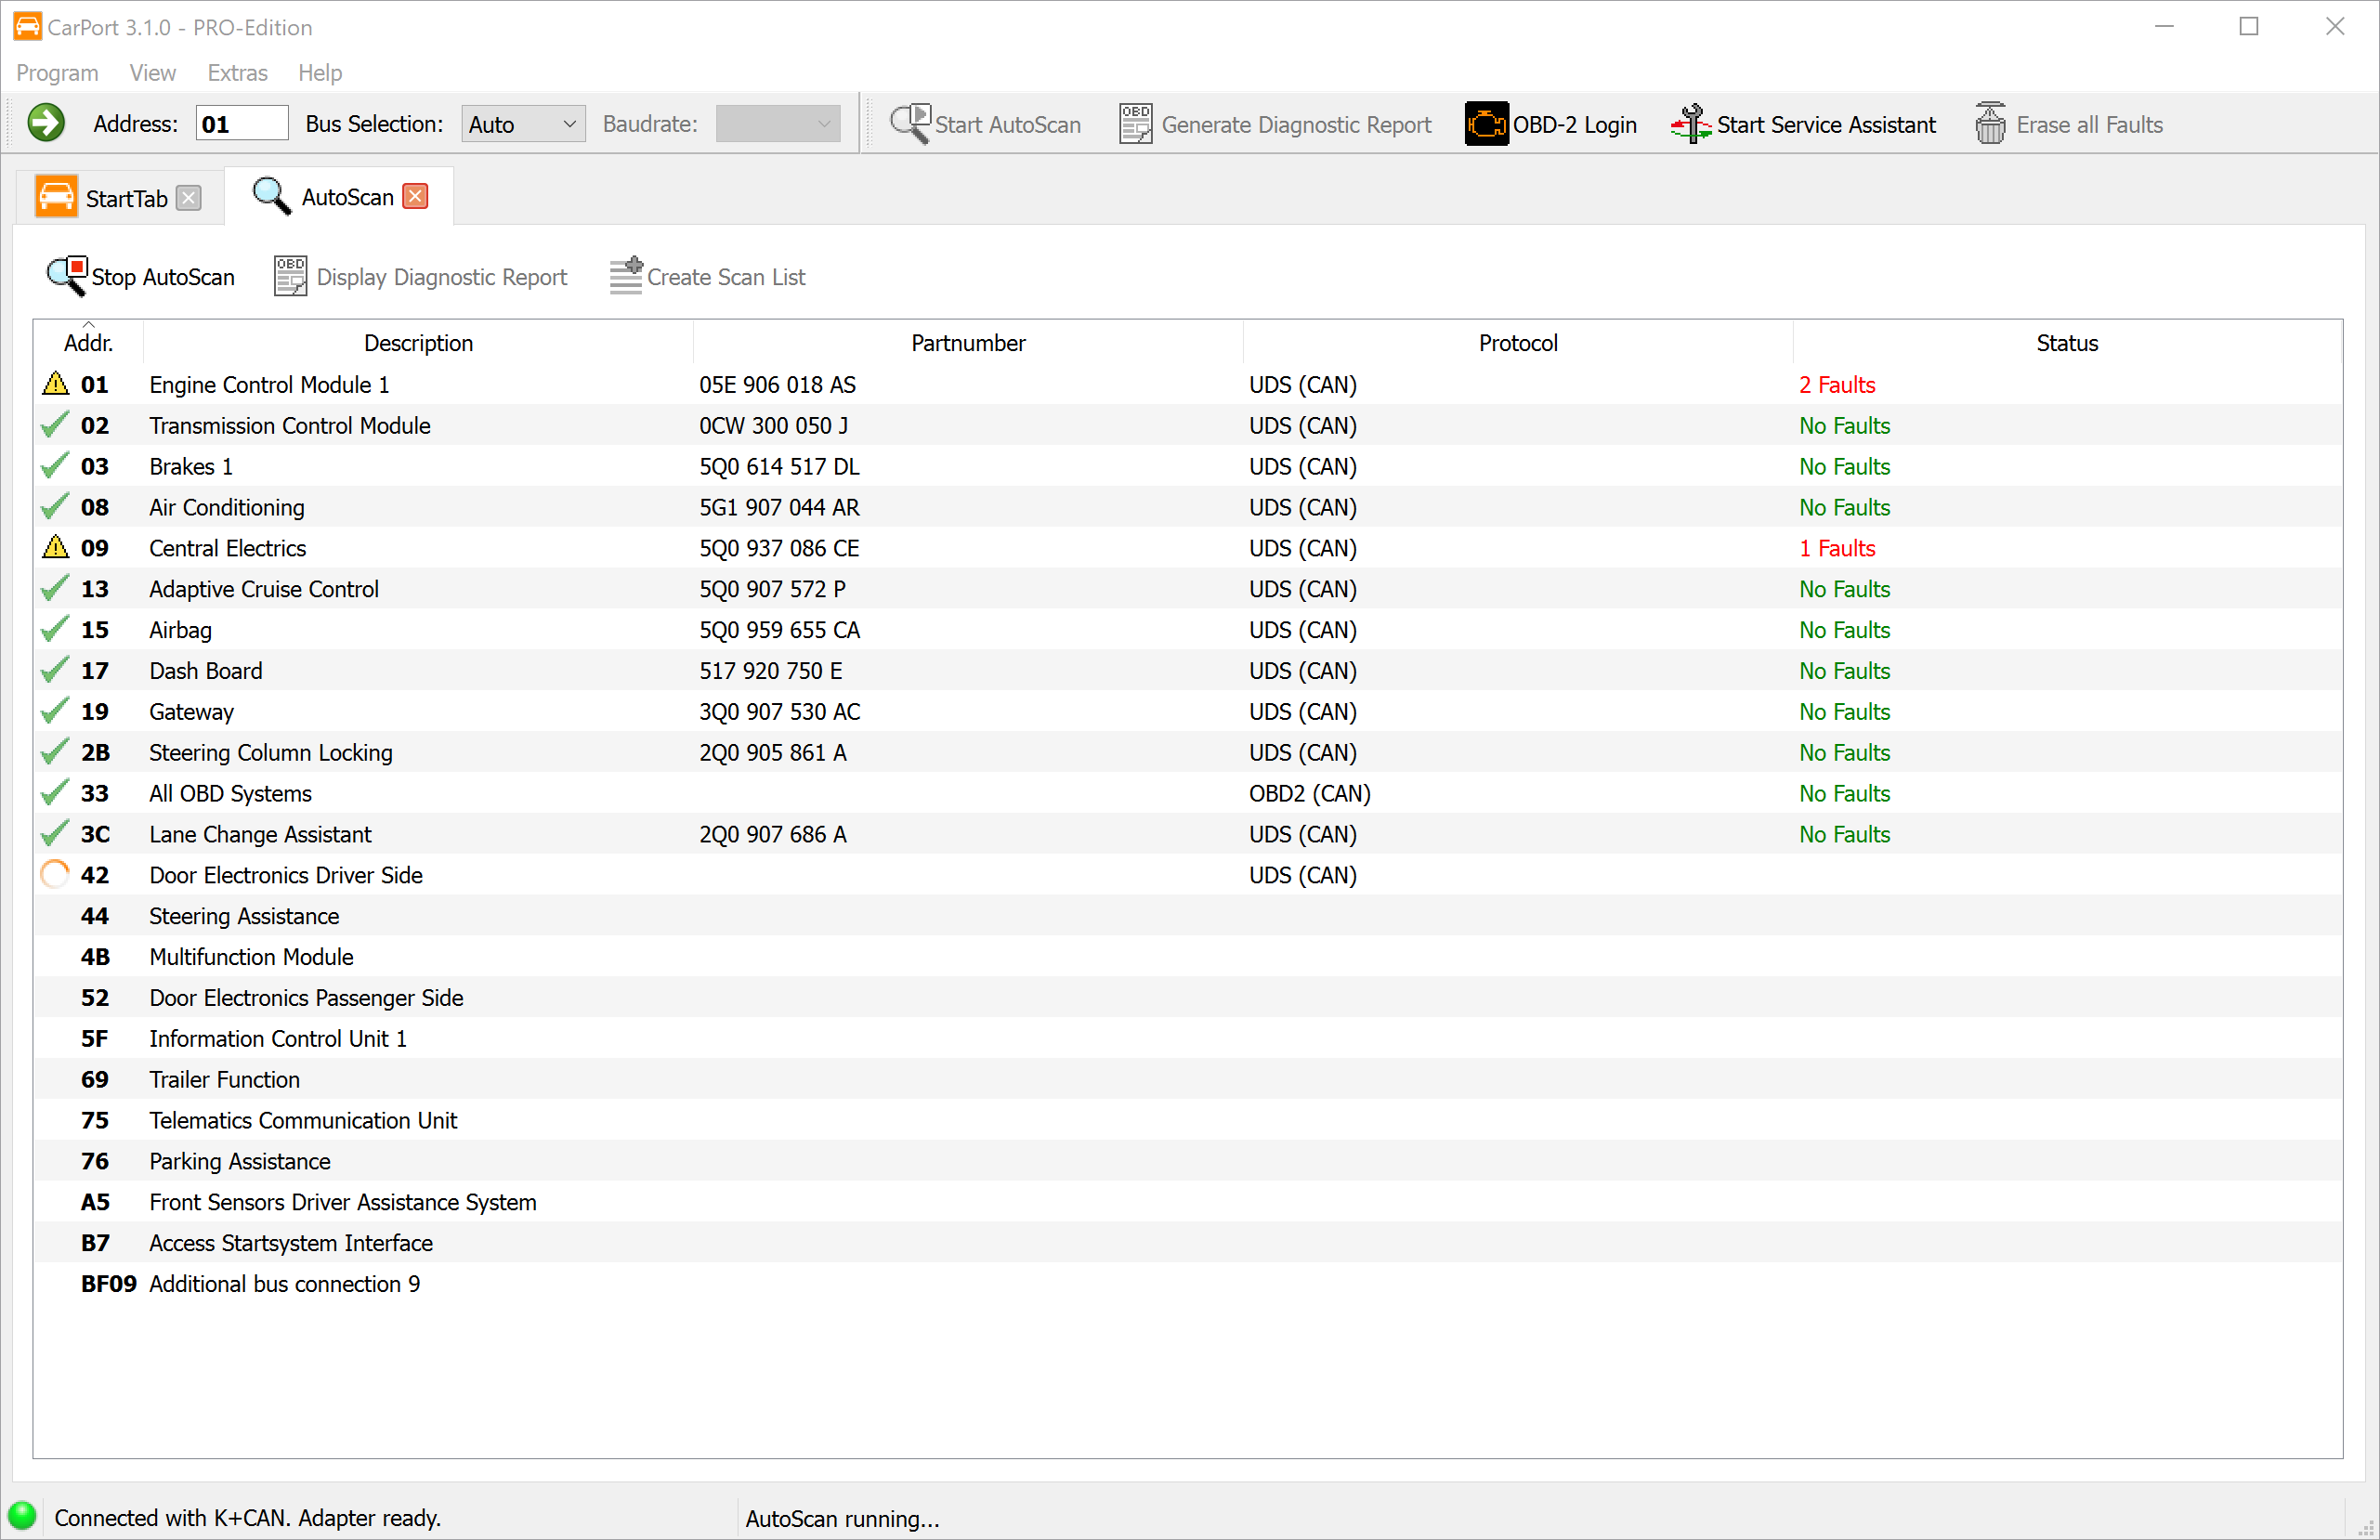
AutoScan is the ideal way to start any diagnostic session. It automatically checks all ECUs installed in the vehicle for faults and delivers a comprehensive status report.
How it works: Technically, the scan runs differently depending on the vehicle generation:
Vehicles with a diagnostic gateway (CAN bus): CarPort first requests the installation list from the gateway. This list (usually) contains exactly the ECUs configured in the vehicle. After that, only these ECUs are queried. This makes the scan very fast (often under 2 minutes).
Vehicles without a gateway (K-Line): There's no central list of installed components here. CarPort therefore has to try addressing every theoretically possible ECU one after another. Since the program has to wait for a timeout for each ECU that isn't present, this can take a very long time (10 minutes or more).
💡 Tip: For vehicles without a gateway, use scan lists to speed up the process dramatically.
Starting the AutoScan: Click AutoScan on the start page or in the toolbar. If automatic detection isn't possible (older vehicles), you'll be prompted to select the vehicle (e.g., Golf 4 (1J)).
Diagnostic report
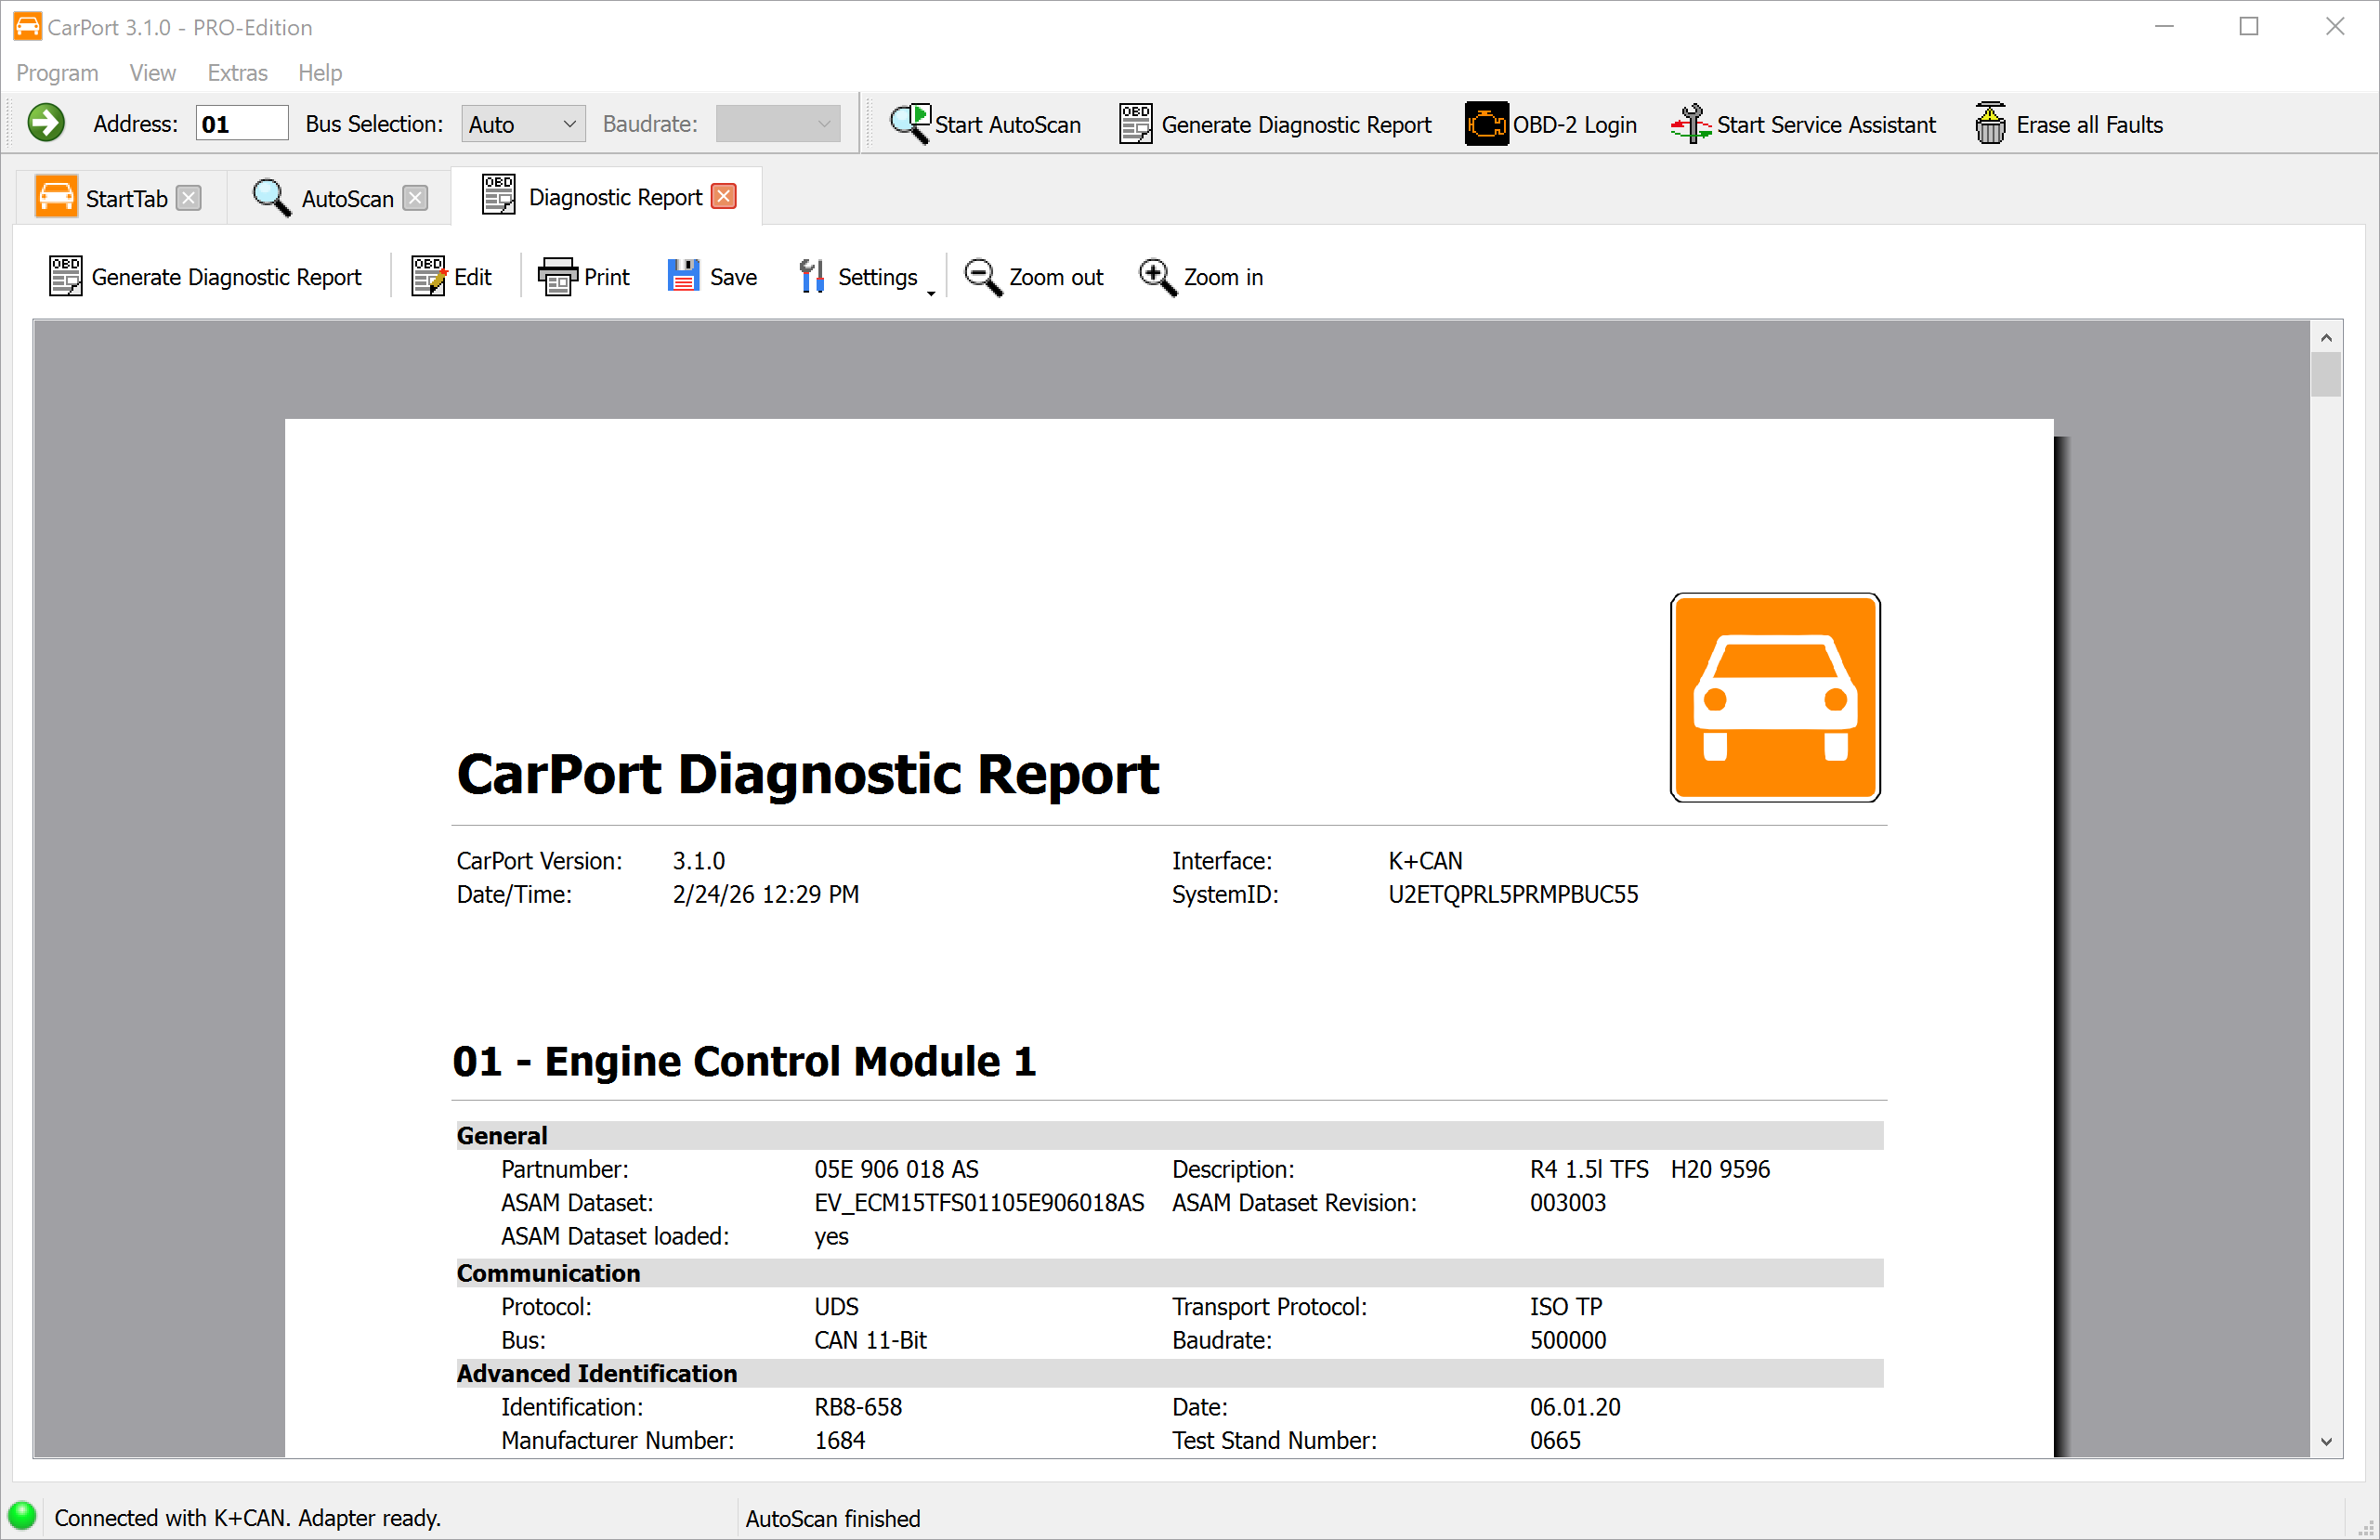
Once the AutoScan is complete, you can display the result as a professional diagnostic report. The report contains the following information:
- Header data: CarPort version, date and time, interface used, and system ID.
- ECUs: All detected ECUs are listed in ascending order of address—each with its info (part number, description, etc.) and the associated fault codes in plain text.
Customizing the report:
- Use
Settingsto specify which data the report should contain (ECU info and/or fault codes). You can also adjust the font size to suit your needs. - Use
Editto switch to edit mode and add your own content to the report—e.g., your own comments, customer data, or repair notes.
Exporting and printing:
- Click
Printto print the report directly. - Click
Saveto save the report as a PDF file.
💡 Tip: The diagnostic report is ideal for your own records, as proof for workshops and insurance companies, or for getting qualified help in forums.
Scan lists
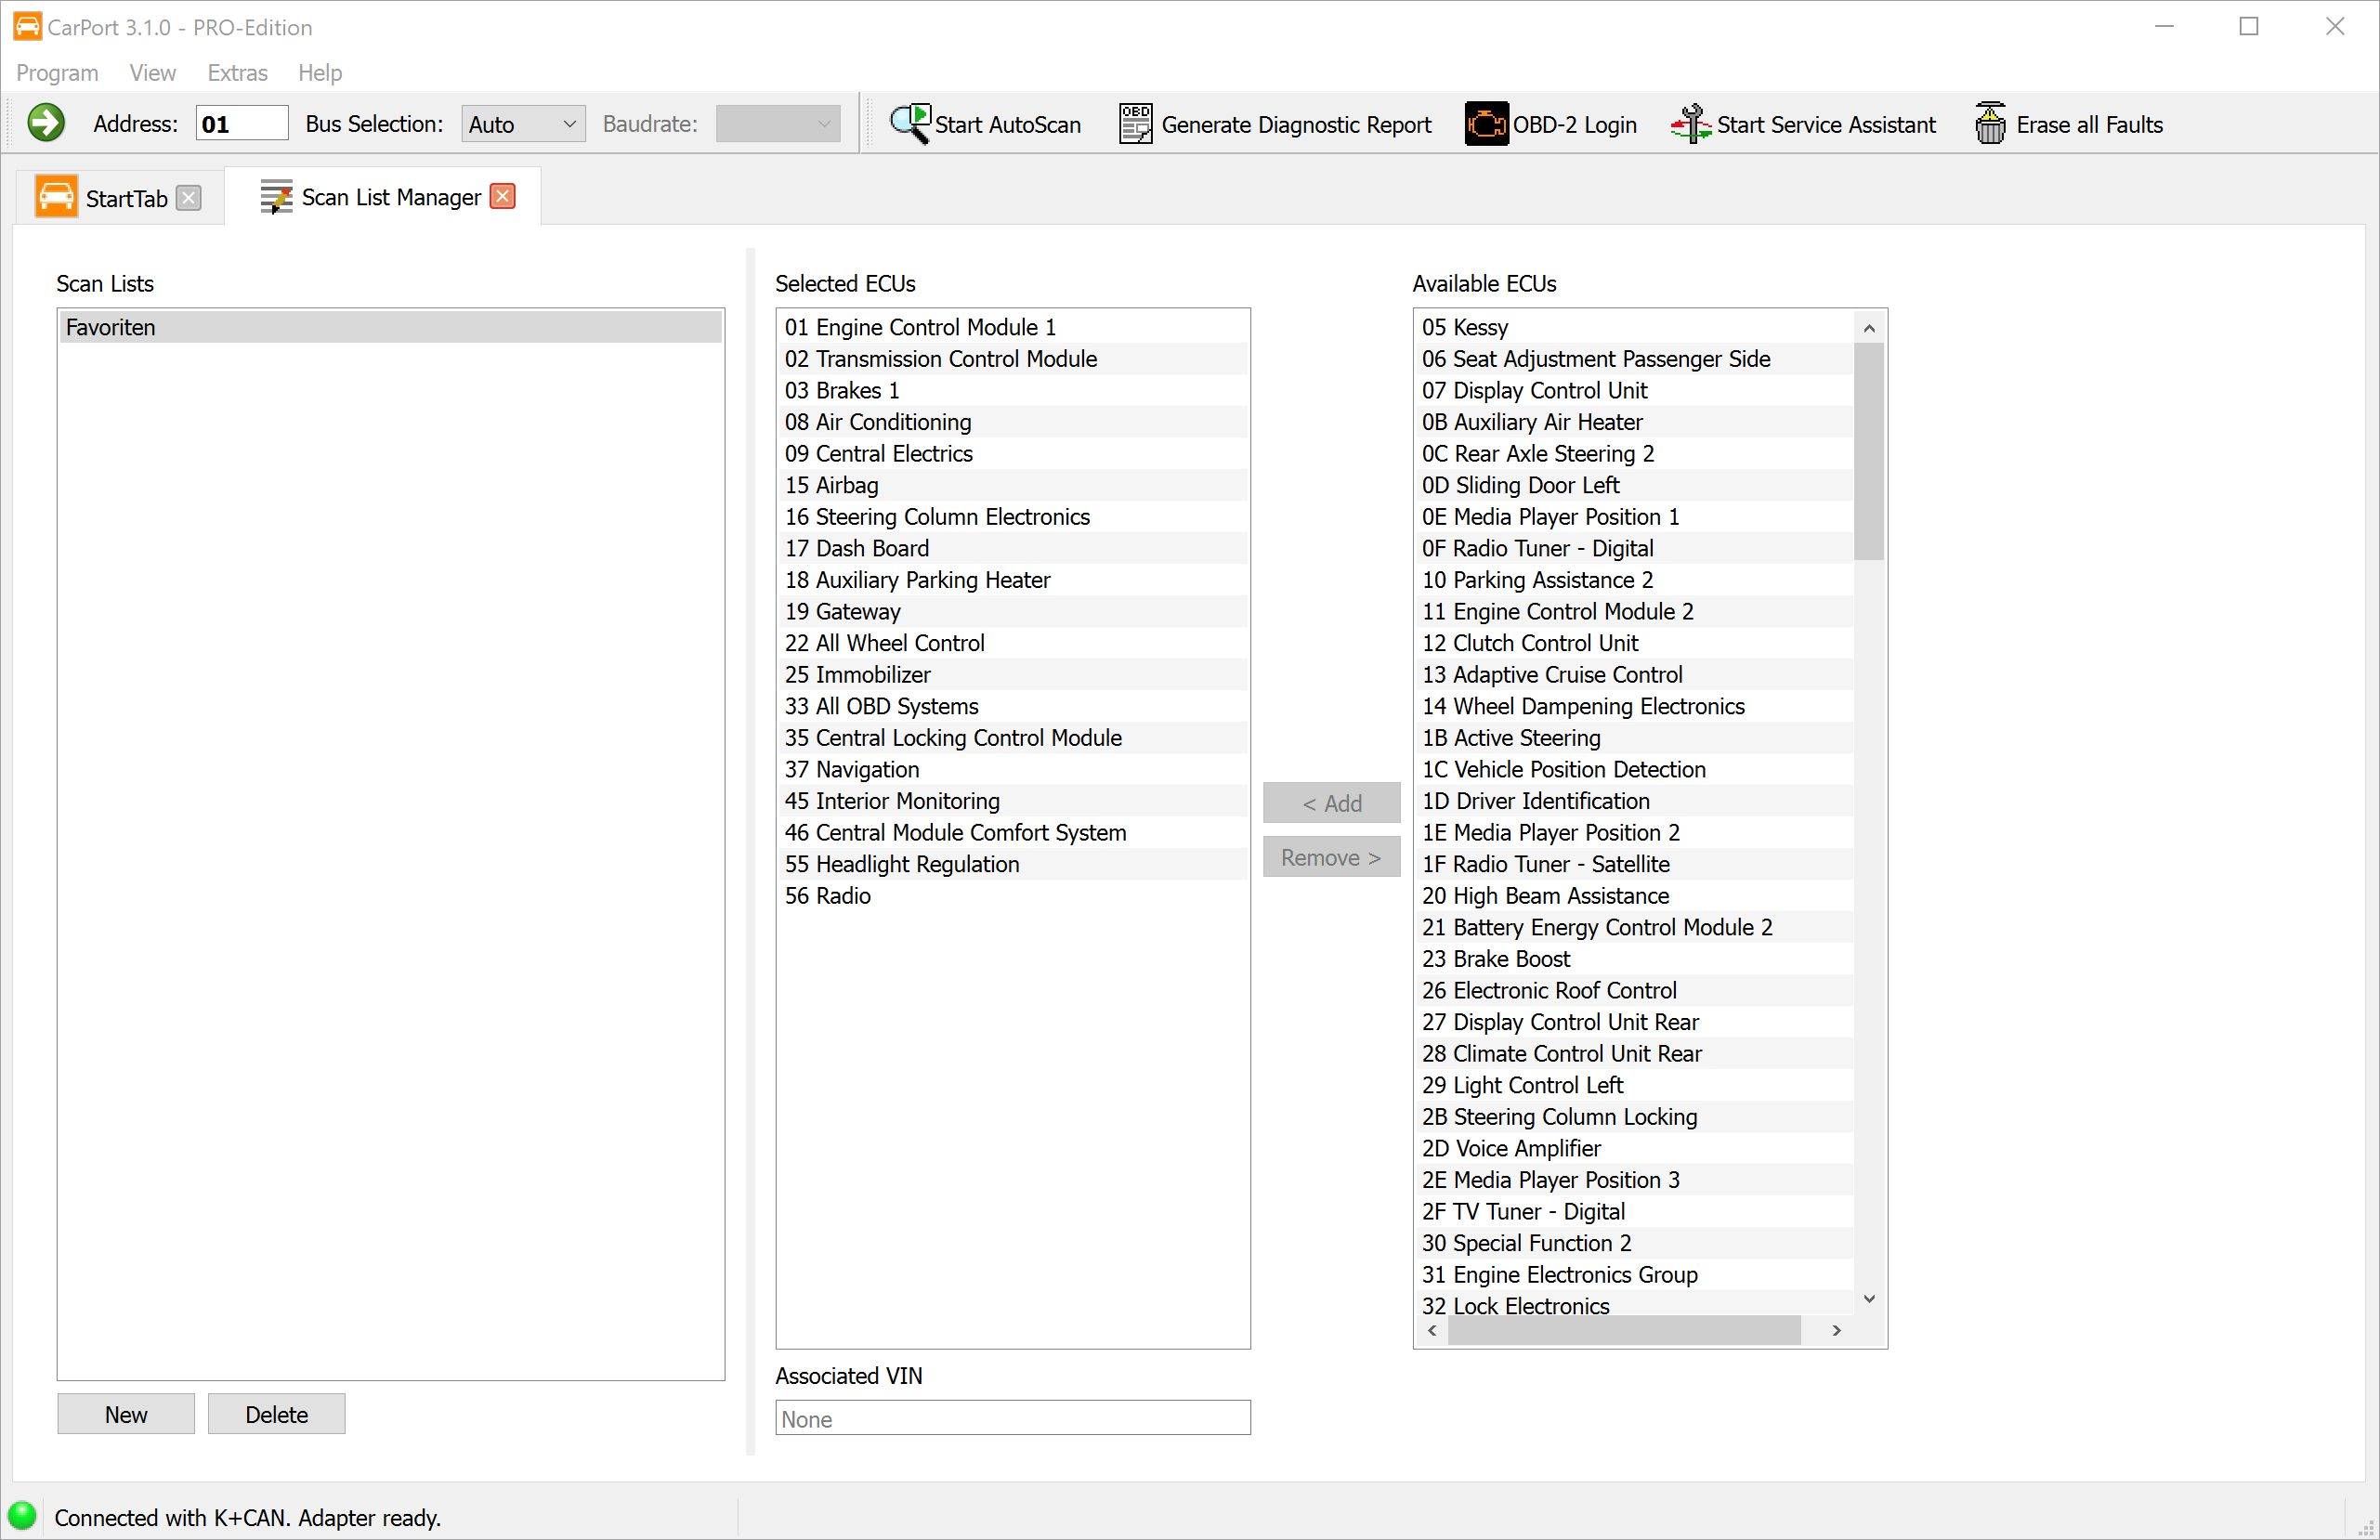
For older vehicles (K-Line), you can define which ECUs the AutoScan should query in order to save time.
Creating a scan list:
- Run a full AutoScan via the model selection once.
- When the scan is complete, click
Create Scan List. - Give the list a name. Optionally, you can link the detected vehicle identification number (VIN) to the list. Effect: The next time you connect this vehicle, CarPort recognizes the VIN and automatically selects the optimized scan list.
You can also manage scan lists manually from the Extras → Scan List Manager menu.
Info
Once you've opened an ECU, the Info tab shows the most important information about it.
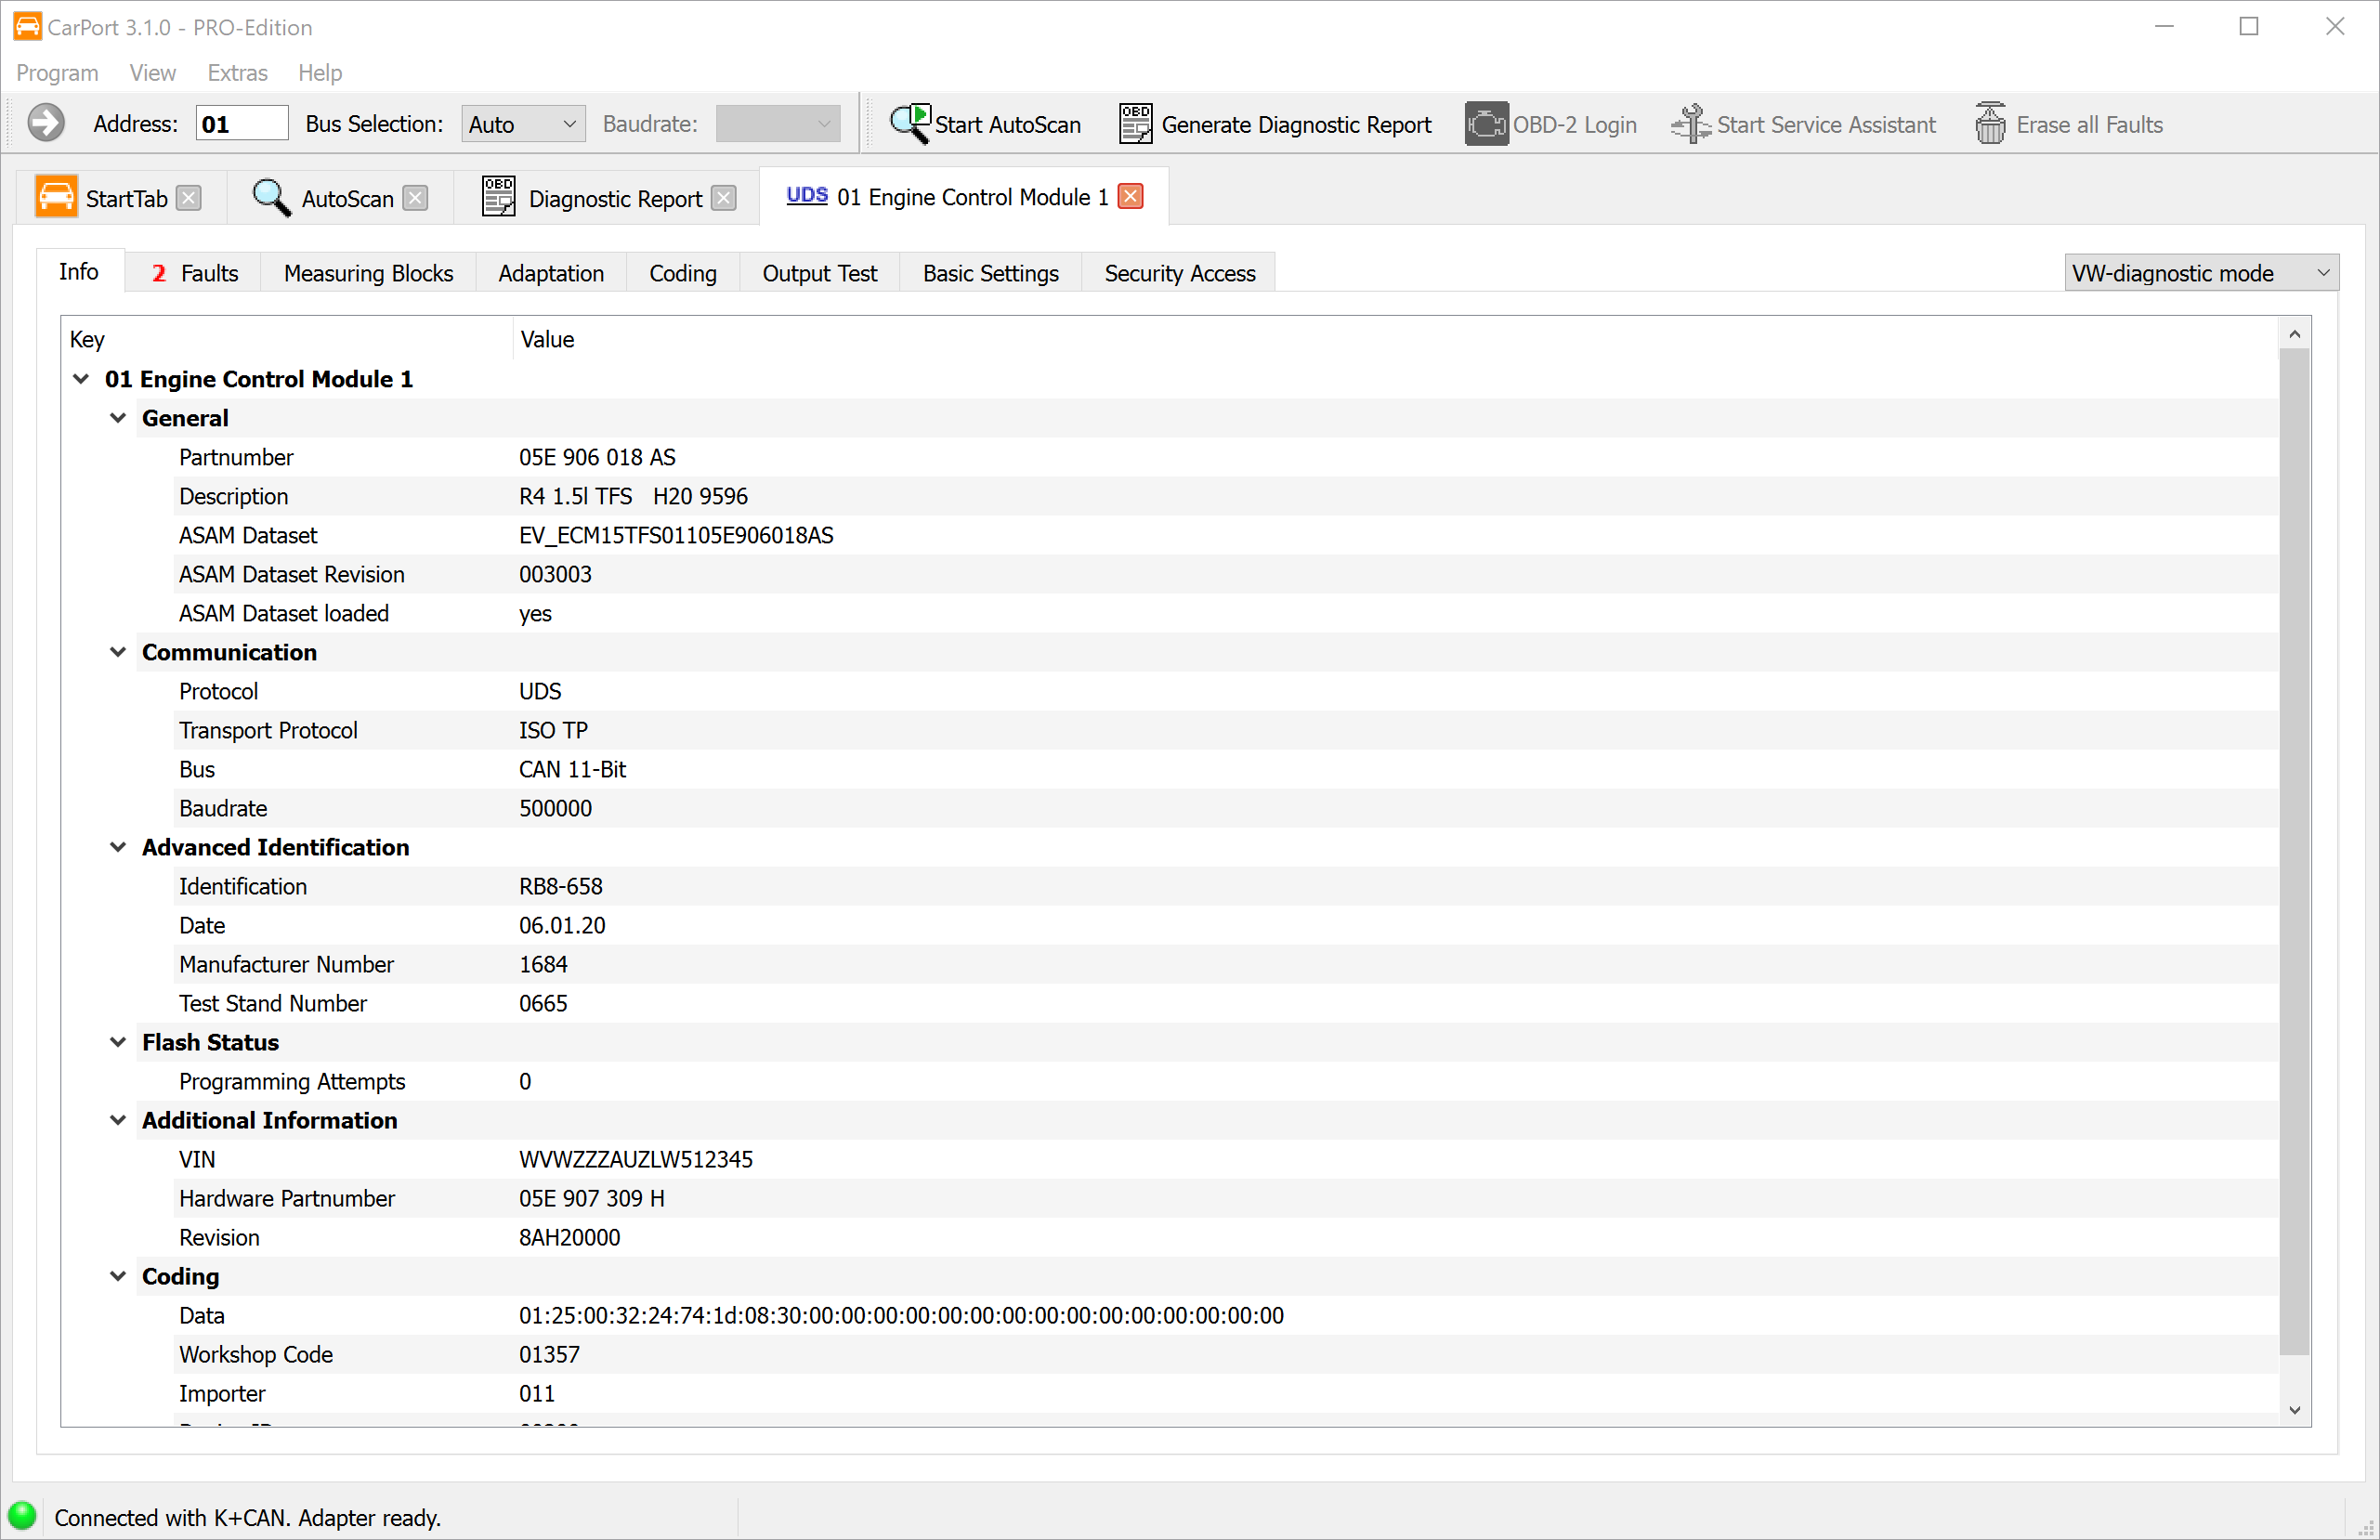
The data shown varies depending on the protocol and ECU, but always includes:
- Part number: The unique identifier of the ECU (e.g.,
05E 906 018 AS). - Description: The ECU's designation (e.g.,
R4 1.5l TFS). - ASAM dataset (UDS only): Important for identifying the correct ECU label data (ODX data).
- Communication data: Information about the bus and protocol used.
You can select any rows and copy them to the clipboard with Ctrl+C or via the context menu.
Faults
The fault memory is the most important tool for fault diagnosis. This is where the ECU stores any irregularities it has detected, which can help you track down the problem.
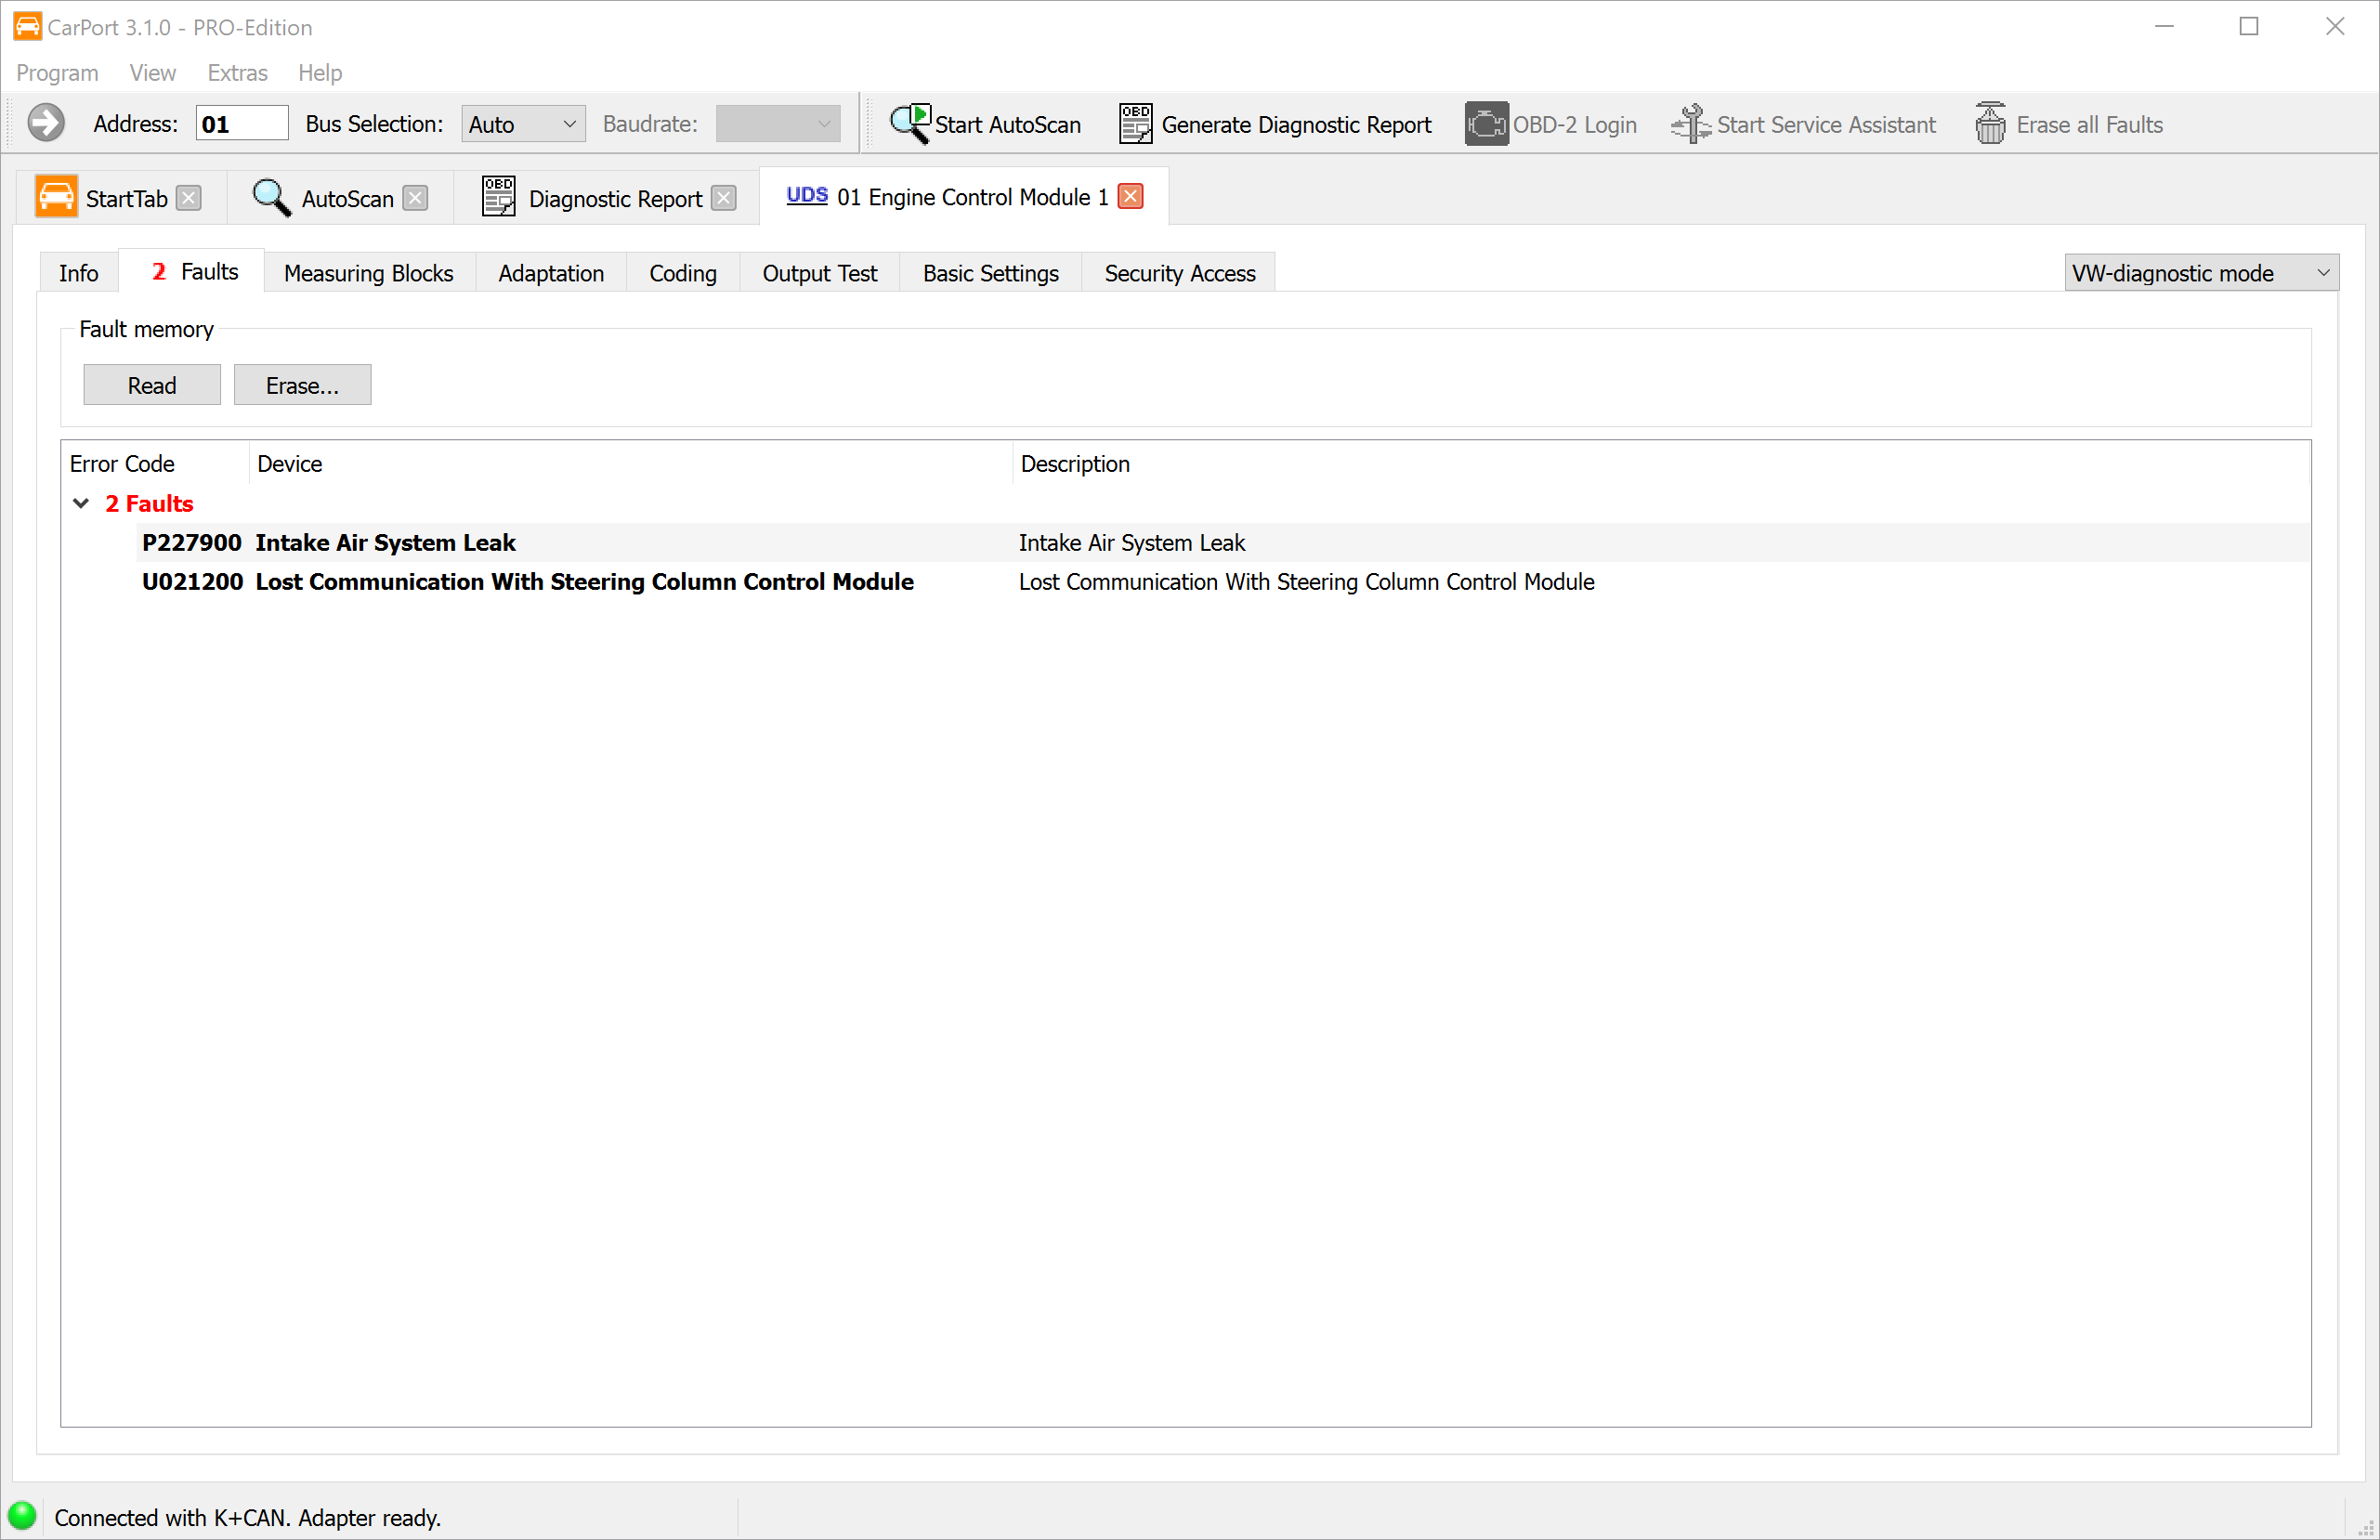
The fault code (DTC – Diagnostic Trouble Code) is stored in a standardized format, e.g., P0100 or 16485. CarPort reads out these codes and displays them in plain text, so you immediately understand which component is affected and what kind of fault is present.
The display includes:
- Error Code: The standardized code (e.g.,
P0100or16485). - Device: Plain-text description of the affected component (e.g.,
Mass airflow sensor). - Description: Plain-text description of the fault (e.g.,
no communicationorupper limit exceeded), optionally with the fault status (intermittent,static)
ℹ️ Background:
Many fault codes start with a letter that indicates the fault category:
- P: Powertrain (drivetrain, engine, transmission)
- B: Body (bodywork, comfort, airbag)
- C: Chassis (suspension, brakes)
- U: Network (communication between ECUs)
Environmental data (freeze frames):
With modern protocols (KWP2000, UDS), the ECU also stores the conditions at the time the fault occurred. This data corresponds in form and meaning to the live measured values (e.g., engine speed, temperature, load) and provides important clues to the cause of the fault.
The freeze frame data is shown when you expand the tree view (click the > in front of the fault code or double-click the fault code).
Actions:
Erase...: Clears the fault memory after you confirm. All fault codes and associated data are removed. The ECU immediately starts reassessing the system status.Read: Reads the fault memory again to update the current status.
💡 After clearing, the fault memory is automatically read again a few seconds later to update the status. If the fault condition persists, the fault code reappears right away. You have to fix the underlying problem first for the fault to go away permanently.
Erase all fault codes
This function lets you clear the fault memories of all ECUs in the vehicle with a single command, without having to open each ECU individually and clear its fault memory manually. This is especially useful after extensive repairs in which fault codes have been set in several systems at the same time.
Prerequisite:
Before the function becomes available, a full AutoScan must have been completed. This ensures that you know the current fault status of all ECUs and make a conscious decision to clear the fault memories.
⚠️ Caution: Clearing deletes all stored fault codes and the associated freeze frame data in every ECU. If necessary, export a diagnostic report beforehand to document the faults.
Clearing methods by vehicle type:
CarPort uses different clearing methods depending on the physical interface:
- CAN bus: CarPort uses a broadcast command that all ECUs receive and process at the same time. As a result, all fault memories are cleared almost simultaneously—the process takes only a few seconds, regardless of the number of ECUs.
- K-Line: Since broadcasts aren't possible on the K-Line, CarPort sends the clear command one after another to each individual ECU that reported fault codes in the AutoScan. Depending on the number of ECUs affected, this can take a few minutes.
ℹ️ Note: Occasionally, ECUs respond differently to the CAN broadcast clear command than to a directly addressed clear command. If fault codes remain in individual ECUs after the global clear, open the ECU in question and clear its fault memory there manually.
Step-by-step instructions:
- Run a full AutoScan to capture all ECUs and their fault codes.
- Click
Erase all Faults...in the toolbar or select the option from theExtras→Erase all Faults...menu. - Confirm the clear request in the dialog that appears.
- CarPort carries out the clearing process and shows its progress.
- When it's done, you should run another AutoScan to verify that all fault memories were cleared successfully.
Measuring Blocks
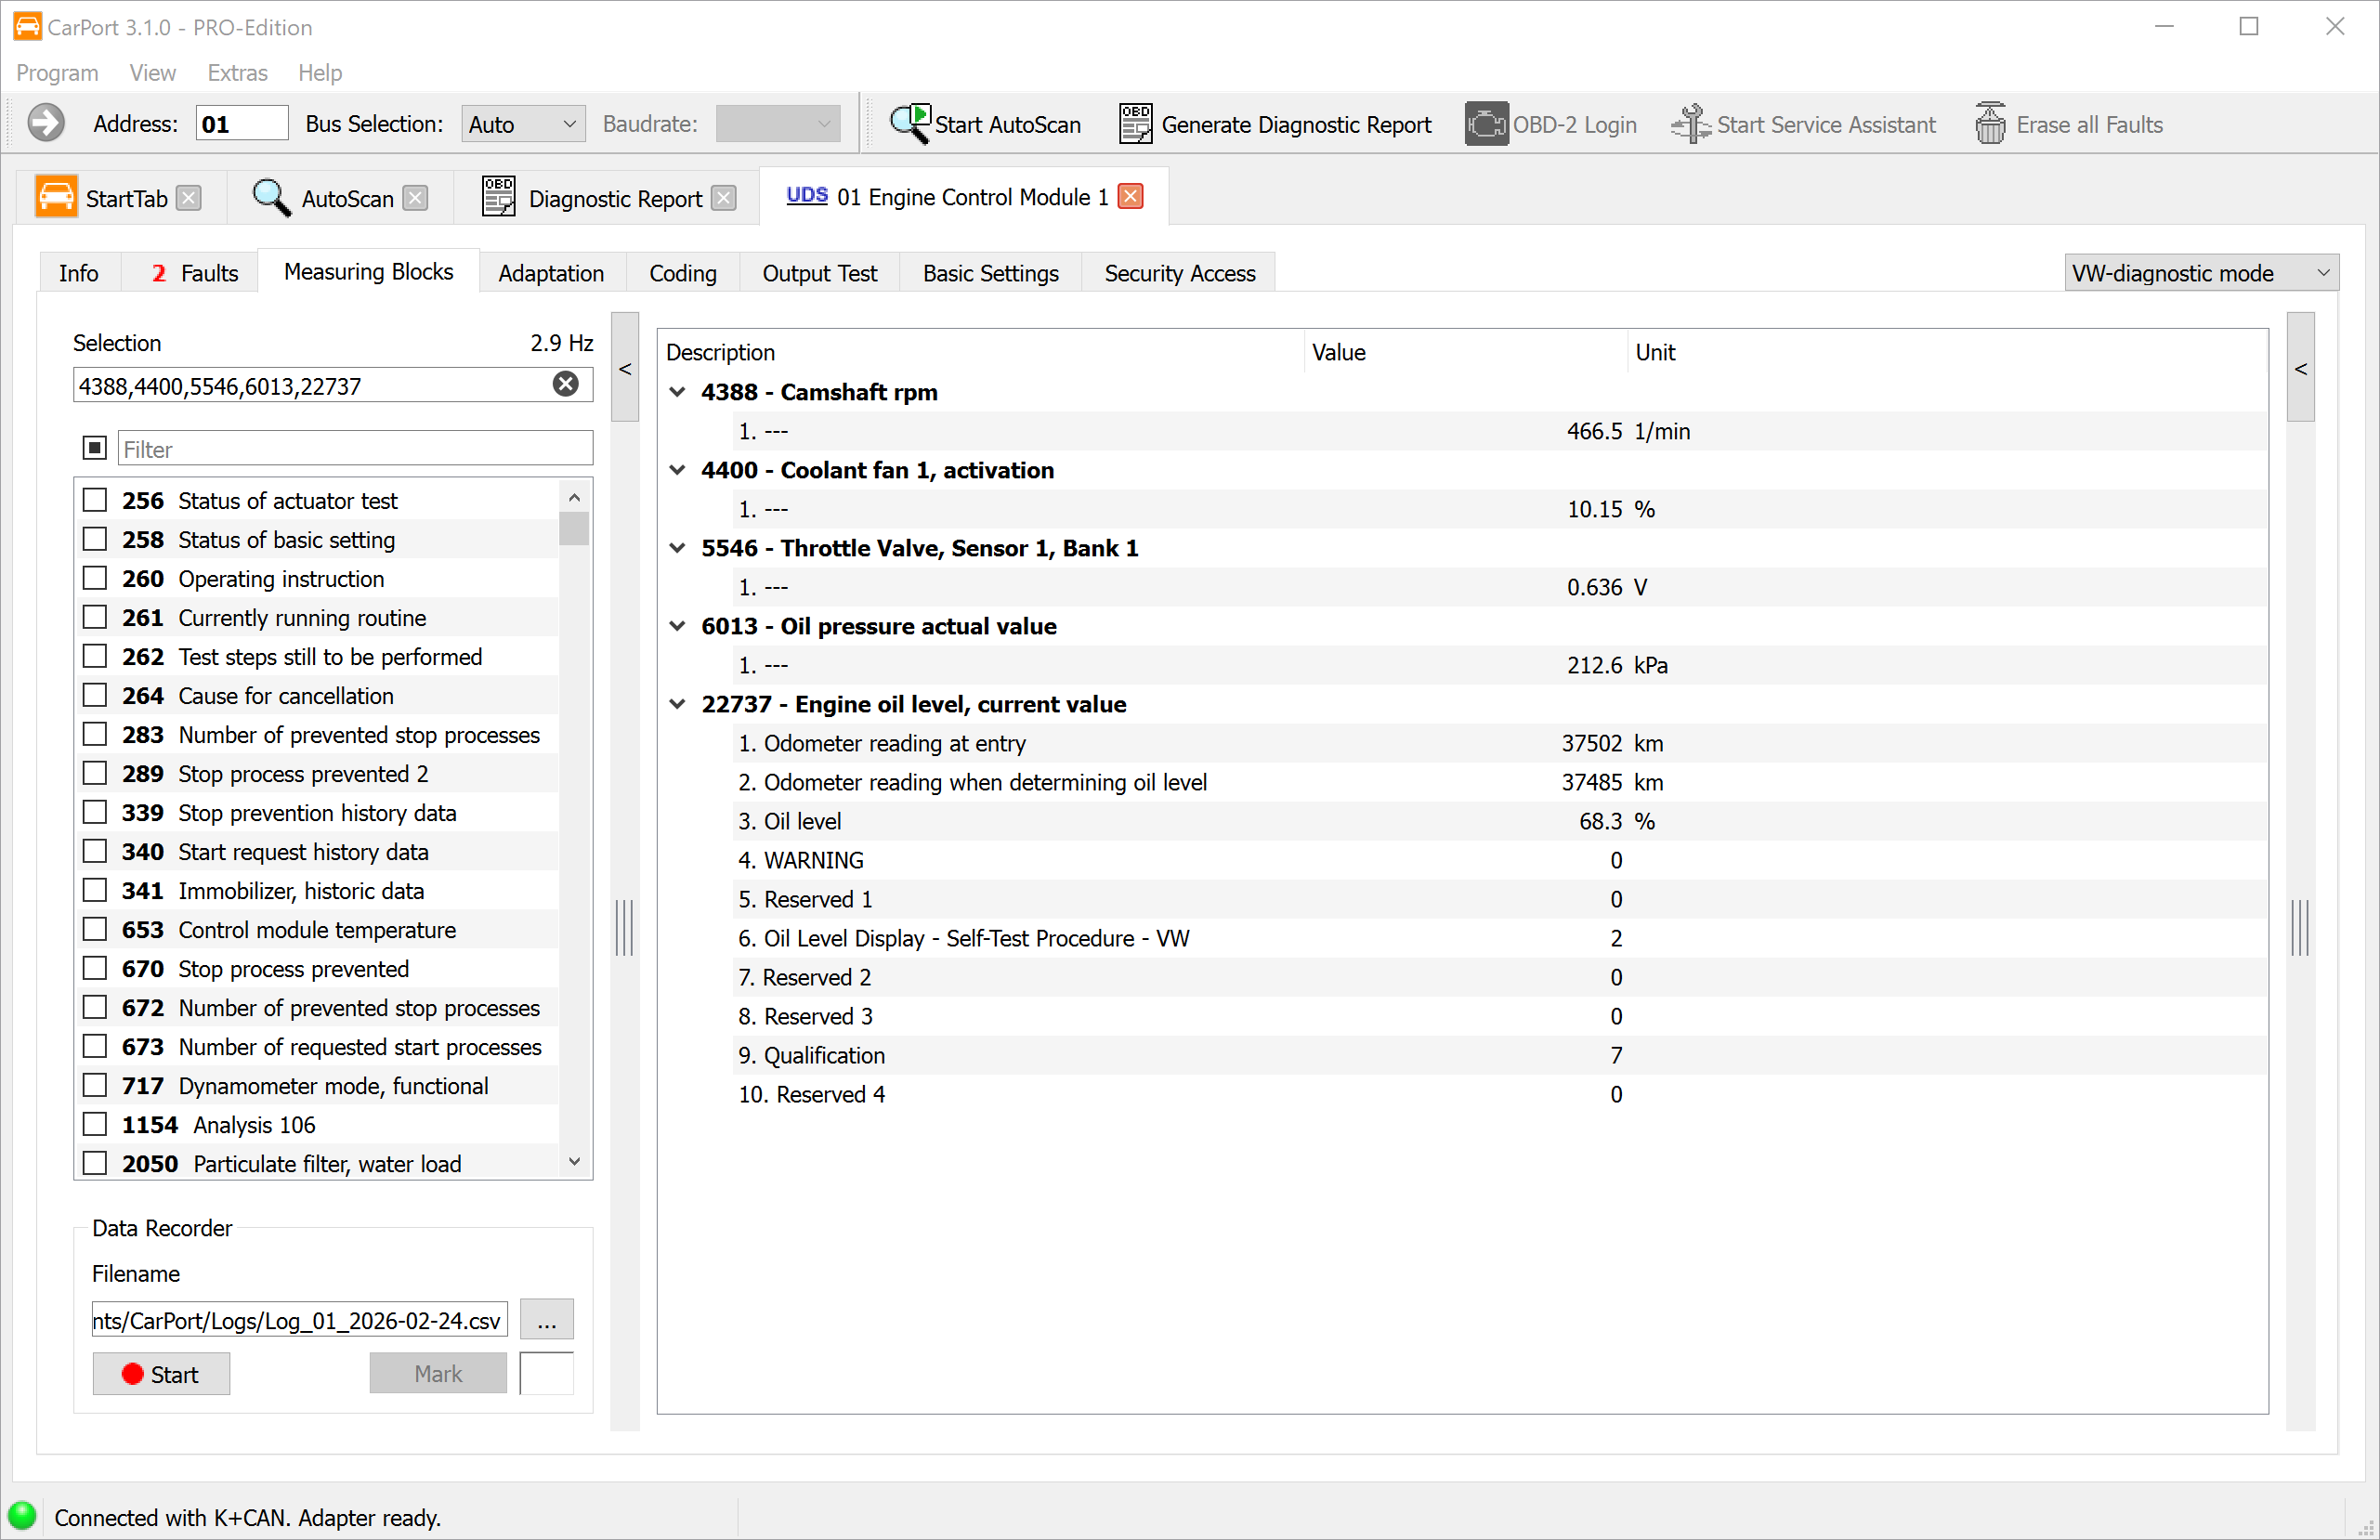
The measured values display lets you view live data from an ECU in real time. This allows you to monitor sensor and actuator data during operation and spot relationships between different parameters—an indispensable tool for dynamic fault analysis.
Depending on the ECU, measured values include:
- Physical quantities: temperature, pressure, voltage, RPM, speed
- Status information: switch states, fault flags, operating modes
- Text values: vehicle identification number, software version
- Raw values: bit or byte fields without physical conversion
How measured values are displayed and organized differs considerably depending on the diagnostic protocol.
KWP1281 / KWP2000
On older vehicles, the data is organized in numbered measuring blocks. Each block contains 4 individual values that (usually) belong together thematically (e.g., block 1: engine speed, coolant temperature, oxygen sensor, engine load).
- KWP1281: Blocks 0 to 255—block 0 is a special case: it contains 10 values instead of 4.
- KWP2000: Blocks 1 to 254.
- If no label data is available for the ECU, CarPort automatically scans all blocks and displays the available values. They are then named generically after the physical quantity (e.g., “Temperature,” “RPM,” “Voltage”).
UDS
On modern ECUs with the UDS protocol, the rigid grouping of 4 values no longer applies. Each identifier can hold any number of measured values. CarPort uses the ODX data (ASAM dataset) of the respective ECU to display the available values with plain-text names, units, and conversion formulas.
Selecting measured values
You can display any number of blocks at the same time. The values are updated cyclically—the more blocks are active, the lower the update rate per value. There are several ways to select measured values:
- Checkbox: Enable individual measured values or blocks by checking their boxes.
- Direct number entry: Enter block numbers as a comma-separated list or as a range with a hyphen, e.g.,
1,2,4-7,10-14. - Text filter: Type a search term into the filter field to narrow down the list (e.g., “boost pressure” only shows measured values whose name contains this term).
Graphical display
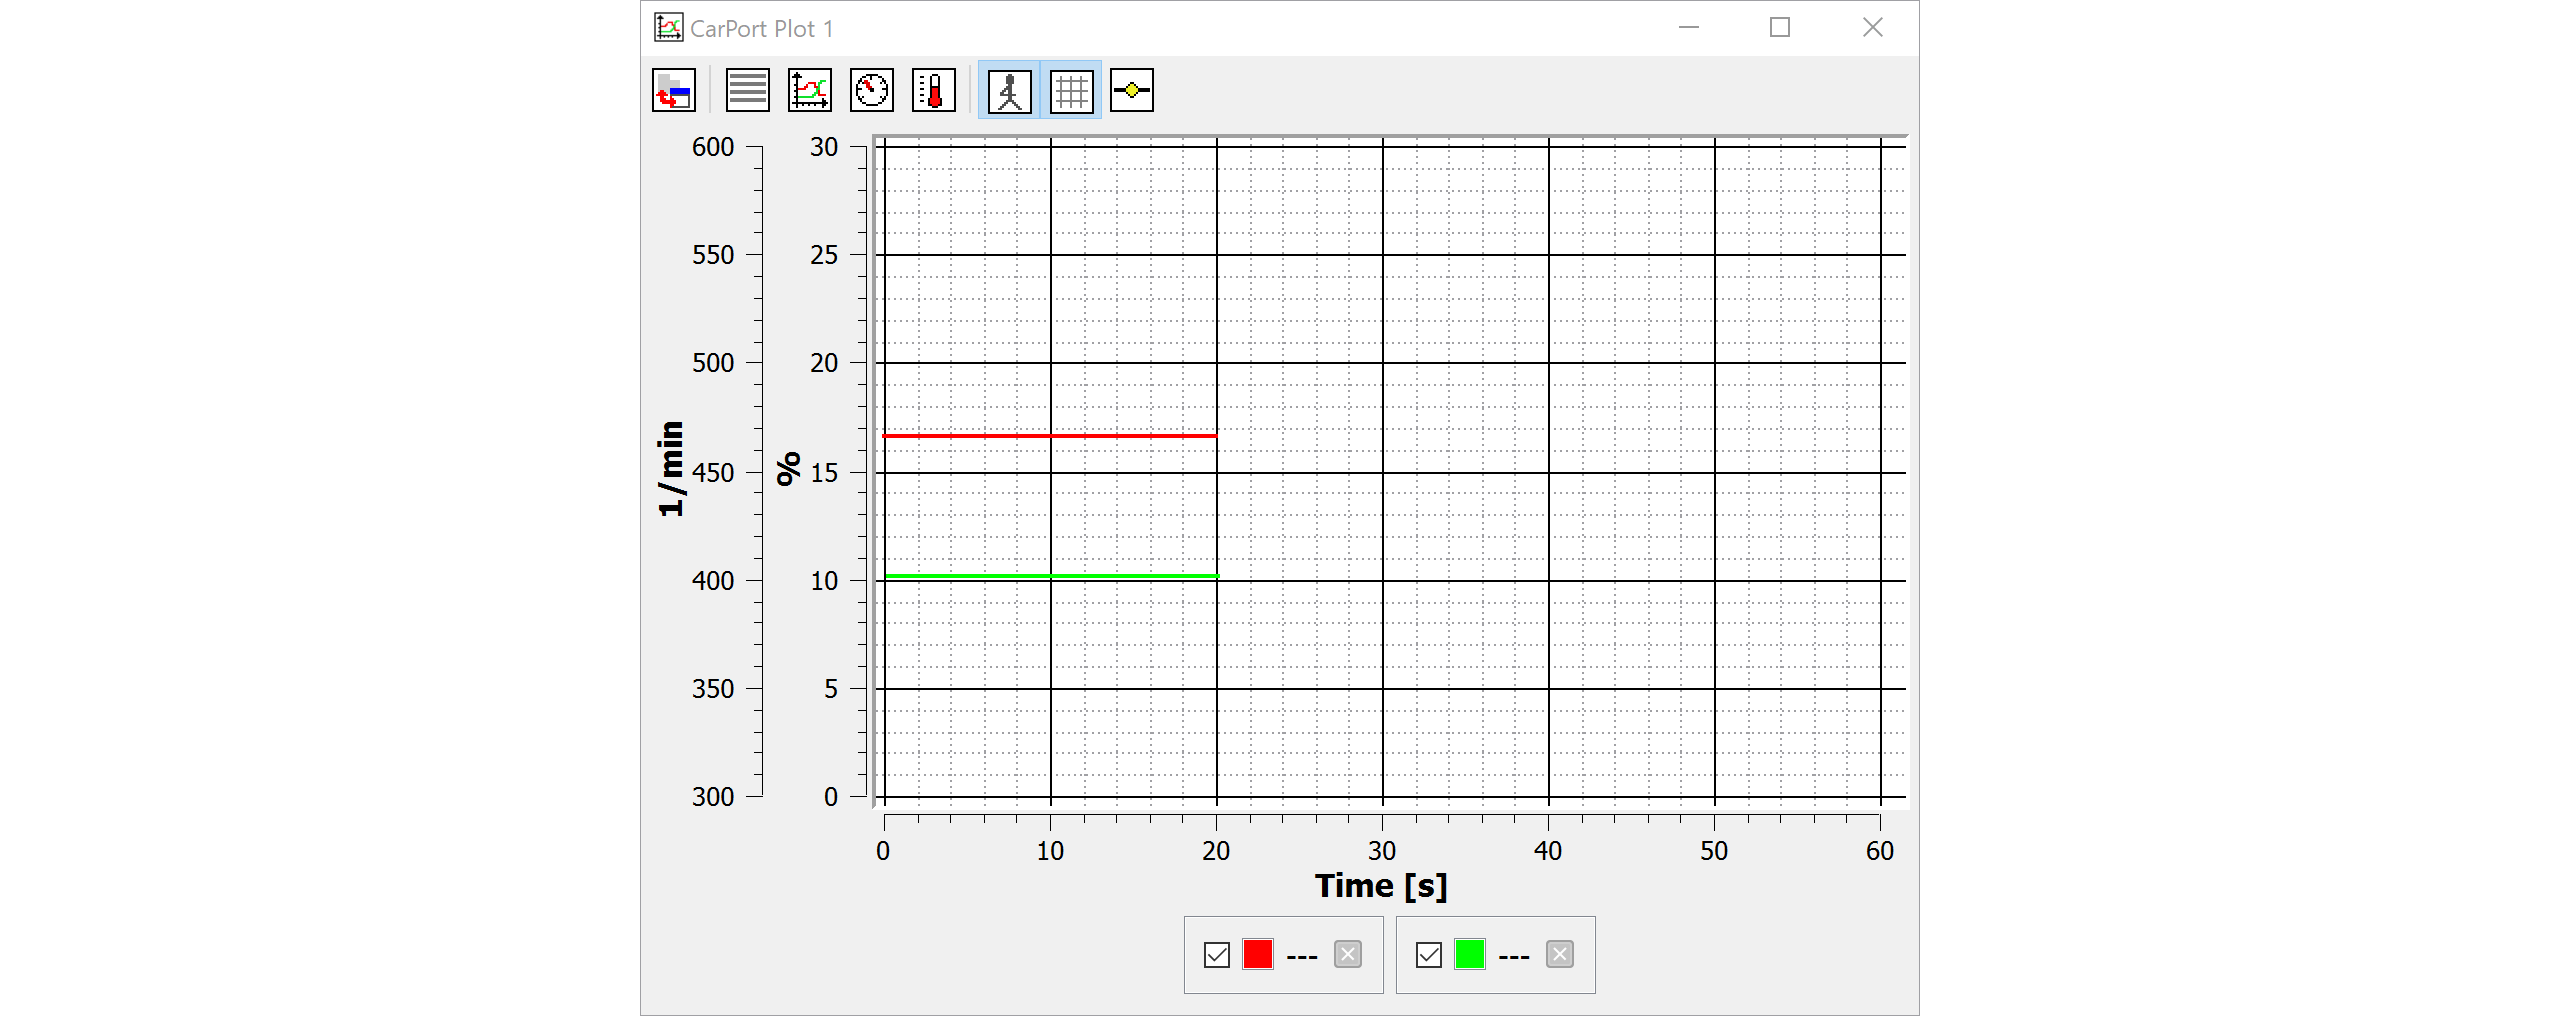
If you want to visualize how values change over time (e.g., specified vs. actual boost pressure, temperatures during a test drive), you can use the built-in plot function.
Adding measured values to a plot:
- Double-clicking a displayed measured value automatically adds it to the current plot. If no plot is open yet, a new plot window is created.
- Using the context menu (right-click a measured value), you can add the value to a specific plot window.
- Several plot windows can be open at the same time to display different groups of values separately.
Display modes:
You can switch between different display modes using the toolbar in the plot window:
- Graph: Line chart with a time axis (default)—ideal for analyzing trends.
- List: Tabular display of the current values.
- Dials: Round gauge display (speedometer look)—well suited for individual values such as engine speed or vehicle speed.
- Thermometer: Bar display—easy to read for temperatures or percentages.
Using the graph:
- Use the mouse wheel to zoom in on the time axis.
- Click and drag to move the visible range.
Data logging
For test drives or longer monitoring sessions, you can record measured values to a CSV file and analyze them afterward in external programs.
Step-by-step instructions:
- Select the measured values you want.
- In the
Data Recorderarea, choose the location and file name. By default, the folder defined in the settings is used, and the file name automatically includes a timestamp. - Click
Startto start recording. - Recording continues until you press
Stop. - While recording, you can set markers to flag specific moments (e.g., “full throttle,” “idle,” “fault symptom”). Enter the text you want in the input field and click
Mark.
You can analyze the resulting CSV file in Excel or in specialized programs such as MegaLogViewer.
ℹ️ Note on the CSV separator: CarPort automatically adapts the separator to your operating system's regional settings (semicolon ; for German settings, comma , for English) so that the file can be opened directly in Excel. If needed, you can set the separator manually in the settings.