
Diagnostic history & debug logs
The diagnostic history documents every session with all changed values; debug logs record the communication so that our support team can analyze errors.
Diagnostic history
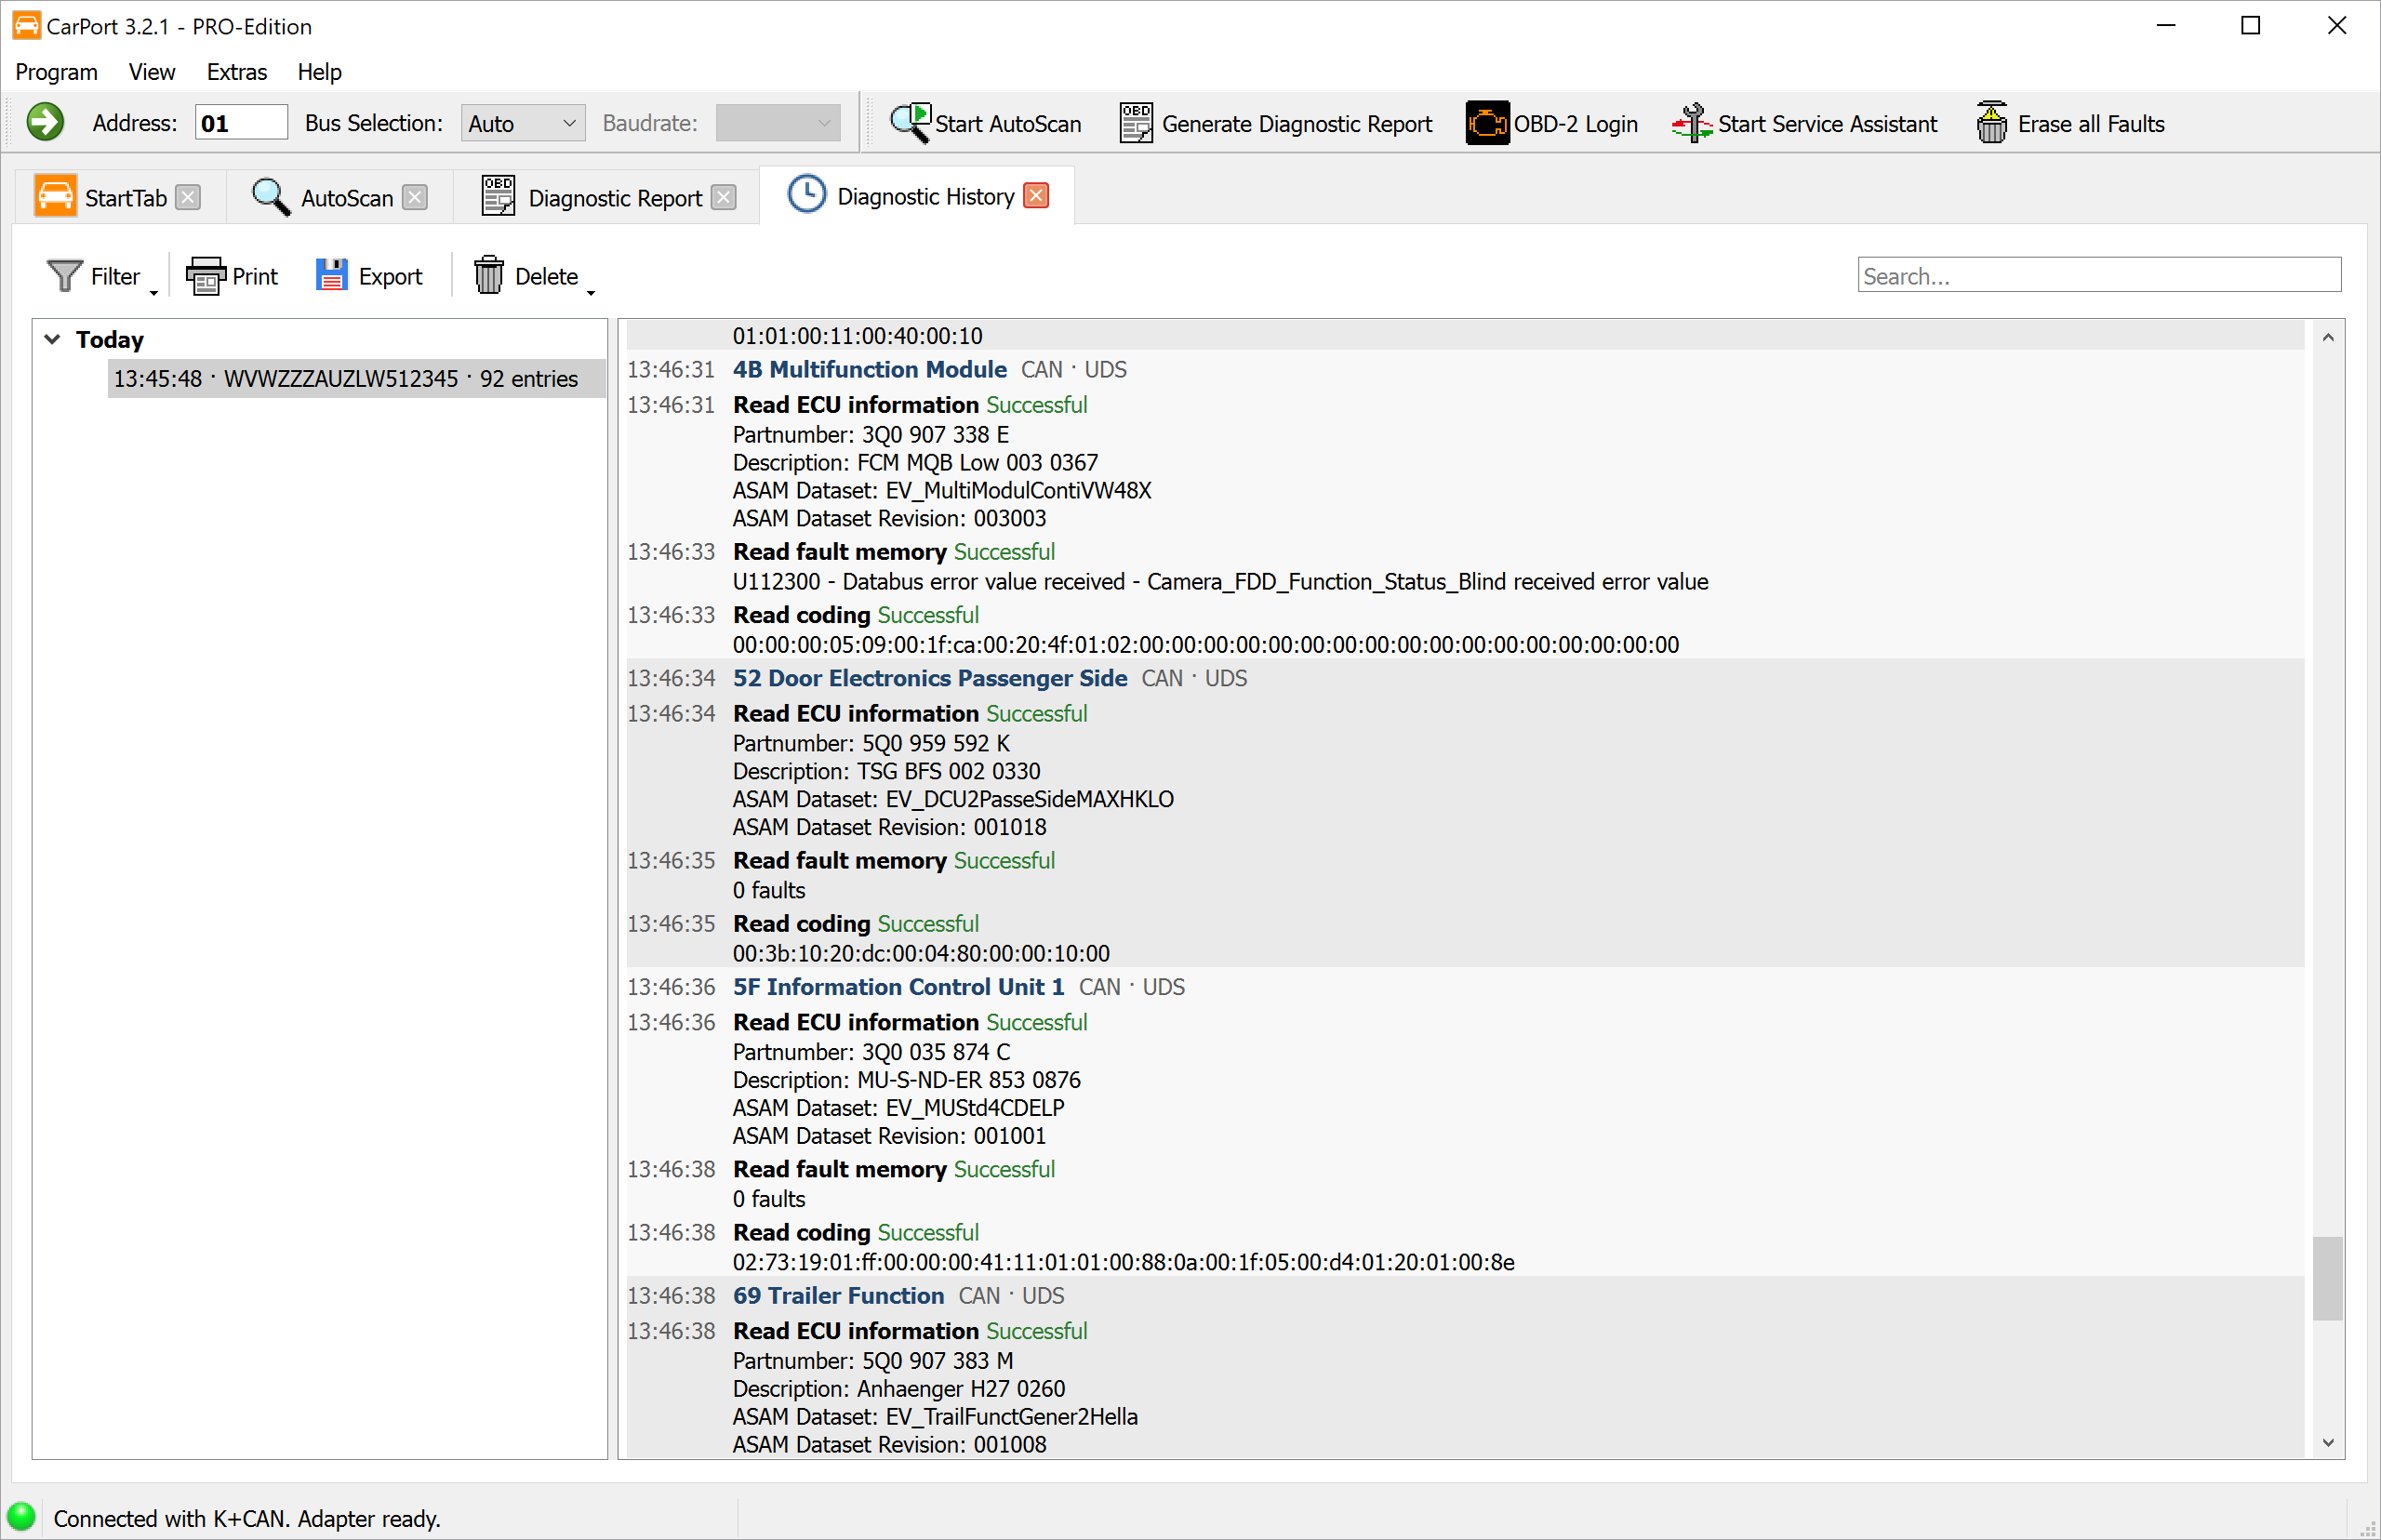
While you work on the vehicle, CarPort records in the background what actually happened: which ECUs you were connected to, which data was read, and—above all—which values you changed. The Diagnostic History makes this record visible.
This is especially valuable if unexpected behavior shows up after coding or adaptation: for every change, the log shows the old value (Before) and the new value (After), so you can still trace an intervention days later and undo it specifically.
You can open the history from the View → Diagnostic History menu or on the start page with the Open diagnostic history button. This section only appears on the start page if recordings already exist.
Layout of the view:
- Left—the sessions: Each vehicle connection forms its own session. It begins with the first logged operation and ends as soon as the interface is disconnected or CarPort is closed. The sessions are grouped by period (
Today,Yesterday,Last 7 days,This month,This year, older ones by year). Each row shows the time, the vehicle identification number (or the interface used), and the number of entries. The current session is already selected when you open the view and grows live. - Right—the log: The selected session in chronological order. Each time the ECU changes, a highlighted row shows its address, name, and communication parameters; below it are the individual operations with time, name, result, and the values read or written. Changes are highlighted in color, as are failed operations.
💡 Tip: With Rename Session (context menu of the session list or the F2 key), you can give a session a name—e.g., “Golf 7 – cornering lights coded.” The name then appears in the list and in the header of the log, making the session easier to find again.
Filtering and searching:
A session can quickly grow to several thousand entries—an AutoScan alone generates several for each ECU. Use Filter to narrow down what's displayed:
| Selection | Effect |
|---|---|
All entries |
All recorded operations (default). |
Changes only |
Only operations that had an effect on the vehicle—e.g., writing coding, writing an adaptation value, clearing the fault memory, output test, basic settings, security access, or SFD unlock. This is the most important view if you want to trace what was changed on the vehicle. |
Read operations only |
Only read access—ECU info, fault memory, coding, adaptation channels, installation list, and measured values. |
Independently of this, you can turn on User operations only. This option hides everything triggered by automatically running functions—AutoScan, Service Assistant, and Erase all fault codes. What remains is what you did on the ECU yourself; the start and end of these functions remain as markers so that the chronological context is preserved.
The Search... field at the right edge of the toolbar highlights all matches in the log in yellow without hiding any entries—useful for tracking down a particular part number, adaptation channel, or fault code in a long session.
Printing and exporting:
Print(Ctrl+P) opens the print preview for the selected session.Export(Ctrl+S) saves the selected session as a PDF, Markdown, or text file. The format is determined by the file extension you choose. The default location is the reports folder specified in the program settings, and the file name already includes the date.
Both functions cover the complete session—including parts that haven't been loaded into the view yet. However, an active filter still applies: anything that's hidden isn't printed or exported either.
💡 Tip: PDF is best for your own records or as proof for a workshop. If you're asking for help in a forum, exporting as Markdown or text is the better choice—you can paste it directly into a post. You can also select individual excerpts in the log and copy them with Copy to Clipboard (Ctrl+C).
Deleting the history:
The Delete button offers two options:
Delete Sessionremoves the selected session with all its entries.Delete Entire Historyremoves all recorded sessions.
You'll also find both actions in the context menu of the session list. CarPort asks for confirmation each time.
⚠️ Caution: Deleted recordings can't be restored. If you want to document the changes, export the session first.
Recording and retention period:
You can specify whether recording takes place and how long sessions are kept in the Diagnostic History section of the program settings.
ℹ️ Note: The diagnostic history records which operations were performed and which values were read or written in the process—not the raw communication on the bus. For the technical analysis of a communication problem, a debug log is still the right tool.
Debug logs
If problems occur during diagnostics—e.g., communication errors, dropped connections, or unexpected error messages—CarPort can record the entire communication with the vehicle as a debug log. These logs contain detailed information about all messages sent and received, the internal processing steps, and any errors or exceptions.
Debug logs are the most important tool our development team has for analyzing the cause of a problem. When you contact support, you'll therefore usually be asked to create a debug log and send it to us.
ℹ️ Note: Debug logs contain only technical communication data between CarPort and the vehicle. No personal data is recorded.
Step-by-step instructions:
- Enable debug logging from the
Extras→Write Debug Logsmenu. - A dialog opens showing the storage location. The default path is the debug folder defined in the program settings.
- Carry out the diagnostics as usual until the problem occurs (e.g., communication error, unexpected error message).
- Close CarPort.
- A Windows Explorer window opens automatically, showing the folder where the debug logs were saved. The log files have a timestamp in their file names, so you can easily identify the relevant file.
- Send the log file by email to our support team so that our developers can analyze the cause.